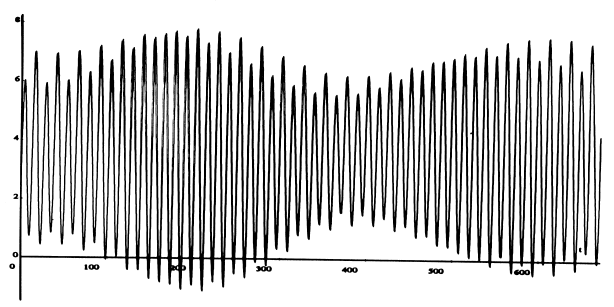
Predicted tide for Bridgeport CT, September 1-28, 1991

The tide prediction method used today in the United States is called ``harmonic analysis.'' The ideal tide curve for any given port is represented as an average height Z0 plus a sum of terms (``constituents'') each of which is of the form f(t) = H cos(at + \phi). The time t is measured in hours, and f comes out in feet. The numbers H,a,\phi are the amplitude, the speed and the phase of the constituent. The speed is given in degrees/hour, and the phase in degrees (so this is the cosine function that accepts input in degrees!). Different constituents have different speeds, which are sums and differences of small integral multiples of 5 basic astronomical speeds, which are:
T the rotation of the Earth on its axis,
with respect to the Sun, 15 degrees/hour
h the rotation of the Earth about the sun, .04106864 degrees/hour
s the rotation of the Moon about the Earth, .54901653 degrees/hour
p the precession of the Moon's perigee, .00464183 degrees/hour
N the precession of the plane of the Moon's orbit,
-.00220641 degrees/hour.
Thus the rotation of the Earth with respect to the fixed stars is T+h = 15.04106864 degrees/hour, and the change in the moon's longitude per hour is T+h-s= 14.49205211 degrees/hour.
The amplitude H and phase \phi for each constituent are determined from the tidal record by Fourier analysis. The number of constituents needed for accurate prediction varies from port to port. In making up the tide tables for Long Island Sound, the National Oceanic and Atmospheric Administration uses 23 constituents. The eleven whose amplitude is greater than .1 foot are:
Symbol         speed       amplitude   phase at
                                      midnight, 9/1/91

  M2     2T-2s+2h = 28.984    3.185     -127.24
  N2   2T-3s+2h+p = 28.439    0.696      263.60
  S2           2T = 30.000    0.538     -343.66
  K1          T+h = 15.041    0.295      142.02
  L2    2T-s+2h-p = 29.528    0.277       -4.72
  O1       T-2s+h = 13.943    0.212      505.93
  Sa            h = 0.041     0.192      301.50
 \nu2  2T-3s+4h-p = 28.512    0.159       45.70
  K2        2T+2h = 30.082    0.144       -2.55
  Mm          s-p = 0.544     0.108       86.82
  P1          T-h = 14.958    0.102      340.11
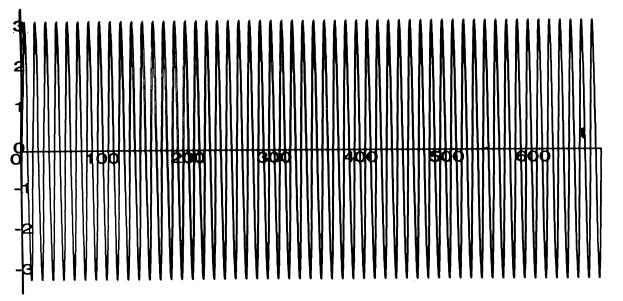
The M2 constituent has by far the largest coefficient. This term alone would give the tide if the sun could be neglected, and if the moon orbited in a perfect circle in the plane of the earth's equator. For Bridgeport, starting at midnight on Sept 1, 1991, this term is (from the table above)
M2 = 3.185 cos (28.984 t -127.24)

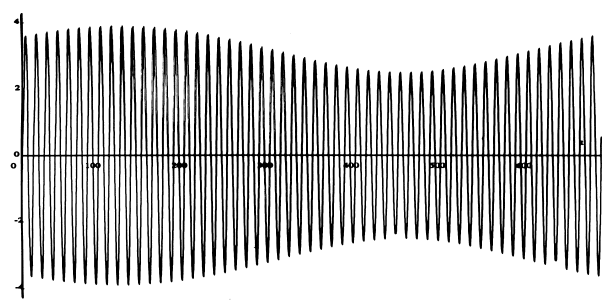
The constituent S2 would give the solar tide if the sun was always in the earth's equatorial plane and the earth's orbit was a perfect circle. The plot of M2 + S2 shows the combined tidal effect of this ideal sun and the ideal moon of the previous graph.

This shows the sun and moon working together at full and new moon, and at cross purposes at first and third quarters. An additional significant effect, too subtle to be read from this graph, is a 2-week cycle of advancement and retardation of the times of high and low tides called the priming/lagging of the tide.
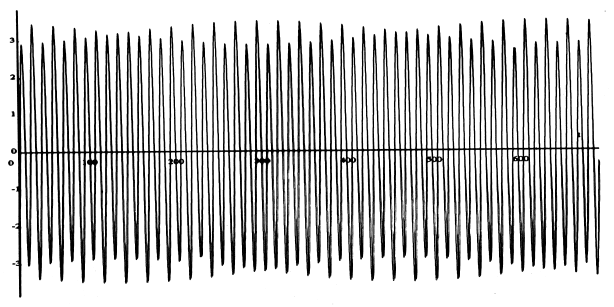
The N2 constituent involves the non-circularity of the moon's orbit. During the month the moon describes an ellipse, and the tides are higher when it is near its perigee (nearest the earth) and lower when it is near its apogee (farthest). The perigee itself precesses with angular velocity p, so this pattern shifts slightly from month to month. The next graph shows the sum of the M2 and N2 components.

The diurnal constituents K1, O1, P1 take into account (among other things) the inclination of the earth's equatorial plane with respect to the plane of the moon's orbit. During a month, the moon spends about two weeks above the equator, and then two weeks below. When it is above, for us in the Northern Hemisphere the high tide when the moon is visible will be higher than the next tide (when the moon is below the earth from our point of view), and vice-versa when it is below the equator. This effect is called the diurnal inequality. Twice a month, when the moon crosses the equator, the two tides are roughly equal. This is shown in the next graph, which gives the plot of M2+K1. (The corresponding inequality for the sun reverses itself twice a year, when the sun crosses the equator at the equinoxes on Sept. 21 and March 21).

When all 23 components are added together, and added to the average height (3.35 at Bridgeport), we get the curve shown in the graph at the top of the page. This represents the predicted tide for Bridgeport for September 1-28, 1991. The actual height of the water depends also on meteorological factors such as barometric pressure and the direction and force of the wind.
Back to Main Tide page.
Back to Tony's Home Page.