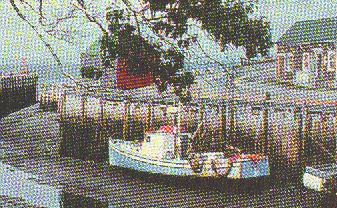

Halls Harbour, Nova Scotia; and Halls Harbour, six hours later.
from Greenberg, p.128A
TIDE PREDICTION People going into or out of a harbor, or anchoring near a shore, need to know in advance about the behavior of the tide. The tide is caused by the pull of the sun and the moon on the oceans, and the rotation of the earth, but its exact pattern at any particular spot on the coast depends very strongly on the shape of the coastline and on the profile of the sea floor nearby. So even though the forces that move the tide are completely understood, the tides at any one spot are essentially impossible to calculate theoretically. What we can do is to record the height of the tide at that spot over a certain period of time, and use these measurements to predict the tides in the future. Here is a typical tide record: this graph shows the height of the water over fourteen days. The port is Bombay, the dates January 1-14, 1884.
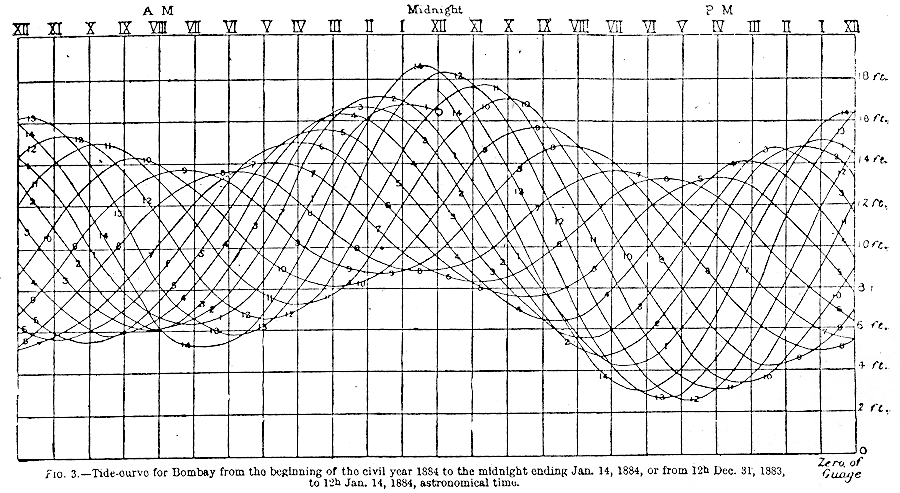
This figure shows the tidal record for two weeks (January 1-14, 1884) at Bombay. The tide was recorded on a cylindrical sheet that turned once every 24 hours. Each daily curve is labelled with its date. Some obvious features: there are usually two high tides and two low tides each day; the tides come about 50 minutes later each day; during the two-week period there is considerable variation in the daily pattern of highs and lows; there is usually a difference in height between two consecutive high tides (the diurnal inequality). [From G. H. Darwin's Encyclopaedia Britannica article.]
Times of high tides are computed and published by the National Ocean Service. For a current sample, click http://www-ceob.nos.noaa.gov/makepred.html. The method used today in the United States is a modification of the method called ``harmonic analysis.'' In fact, until 1965 tide predictions were generated by machines along the lines of this one

designed by Kelvin (then Sir William Thomson) in 1873,
based on a suggestion of Beauchamp Tower's for
summing several trigonometric functions with independent
periods. This machine is the embodiment of the
harmonic method of prediction of tides.